Monthly Archives: September 2011
Info
Useful Lists Section – Updated (Sep 22, 2011). (Link)
Multiple vs Single-Point Tolerances
It often puzzles people as to how one should select one approach over the other. It is often considered that for quality control (QC) purposes one may use single-point approach, while during product and/or method development stages one may use multi-point sampling approach. The single point approach is often derived from multi-point sampling used during the product development stage. It is important to note that for ER products usually there are no single-point tolerances, even for QC purposes. Should, or do, these approaches provide different outcomes? For example, with the multi-point sampling approach dissolution may be measured at 5, 10, 15, 20, 30, 45 and 60 minutes, and for QC purposes a single sampling time of say 30 minutes may be chosen. The dissolution results at 30 minutes should exactly be the same whether one uses multi-point or single point approach as dissolution is property of the product which remained the same. Continue reading
Faster Dissolution Results Do Not Necessarily Mean A Loss Of Discriminatory Power
Often it is assumed that if a test provides faster dissolution, then its discriminatory ability may be diminished or compromised. Unfortunately, this is an incorrect view. In this regard, it is invariably assumed that the slower results obtained using Paddle/Basket apparatuses are the reference, or the most discriminatory, and any increase in dissolution rate should by default be considered as less discriminatory.  However, before one considers this comparison, it may be important to decide which results are the correct ones, the slower one obtained using Paddle/Basket or faster ones using any other approach (higher rpm, different apparatus etc). Looking at the Figure 1 let us assume that the lower profile is obtained using the Paddle apparatus and the upper using some other experimental condition, should the method which produced the upper profile be considered less discriminatory or less desirable? It is quite possible that in fact the upper curve may be a more accurate representation of the characteristics of the product than the lower one. If so, then the results obtained using Paddle, even slower, should be considered as an incorrect representation of the product.
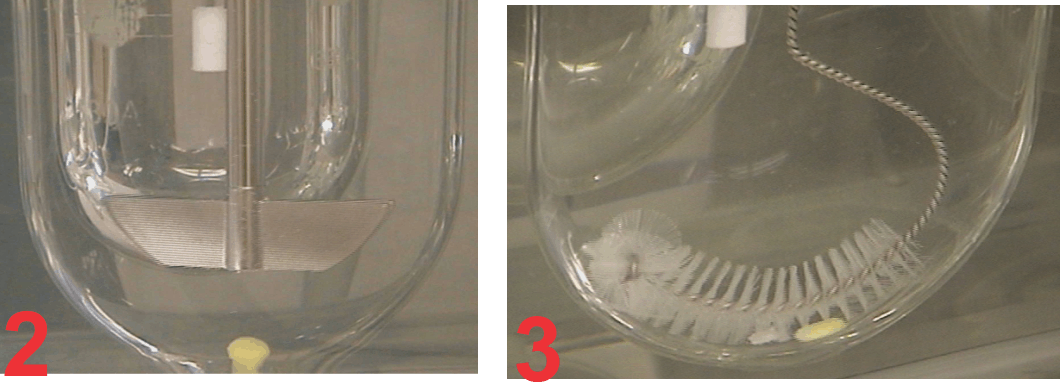
This is in fact the case here. The profiles shown here are of 60 mg diltiazem IR tablet products using Paddle (75 rpm, lower curve) and crescent-shape spindle (25 rpm, upper curve). The reason for the slow rate of drug release from tablets using Paddle, even at 75 rpm, is that the tablets are stagnant at the base of the vessel (Figure 2) and there is no, or limited, tablet-medium interaction or drug dissolution from the bottom of the tablet.

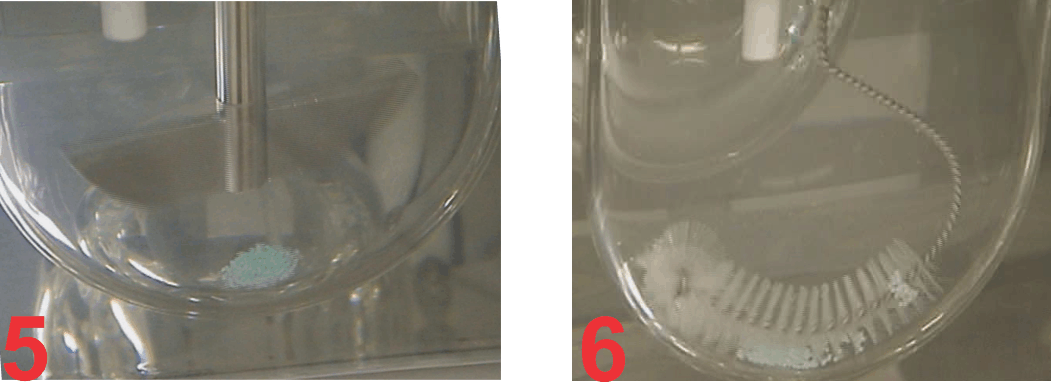
On the other hand, as the tablet moves with crescent-shape spindle, the tablet-medium interaction is from all sides of the tablet and thus faster dissolution with corresponding higher results (Figure 3). Similar, behaviour was observed with beads from a capsule product. In this case, a 120 mg ER diltiazem capsule product was analyzed (Figure 4). Again, lower (slower) drug release was observed using Paddle at 75 (Figure 5), while higher drug release was observed using the crescent-shape spindle (Figure 6). It can, therefore, be concluded that lower dissolution rate using Paddle may not reflect a better discriminatory ability but is a poor reflection of product-medium interaction, thus false dissolution characteristics of a product. For further discussion on the subject of poor product-medium interaction, and poor dissolution using Paddle apparatus please see the publication (link). 

